
Press kit
Everything on this page may be used in coverage of UptimeLogger without asking first: the descriptions, the screenshots and the icon. No approval step, no embargo, no conditions beyond not presenting the application as something it is not.
In one sentence
UptimeLogger is a free background application for Windows and macOS that records every interruption of an internet connection and shows the history as a calendar heatmap.
In three sentences
UptimeLogger watches an internet connection around the clock and writes down when it was gone and for how long. A local dashboard shows the current status, the figures for any period — outages, time offline, longest outage, availability — and a year of history as a calendar heatmap. It is free of charge, needs no account, sends no telemetry and keeps every recorded event in a database on the machine it runs on.
In five sentences
UptimeLogger watches an internet connection around the clock and writes down when it was gone and for how long. Instead of ICMP pings, which need administrator rights on Windows, it opens ordinary TCP connections to a configurable list of servers — public DNS resolvers addressed by IP, so a broken name lookup is not mistaken for a broken connection. A tray icon shows the current state; the dashboard is served by the application itself on the local machine and opens in a browser, which is also how it reaches a phone on the same network if that is switched on. Recorded events can be exported as CSV, and a PDF report summarises a chosen period for a conversation with the provider. The application is free of charge, has no account and no cloud component, and its source code is not published.
Facts
- Name
- UptimeLogger
- Current version
- 0.2.2, released 15 September 2026 — changelog
- Systems
- Windows 10 or newer · macOS 11 Big Sur or newer (universal, Intel and Apple silicon)
- Price
- Free of charge. No trial, no paid tier, no advertising.
- Source code
- Not published. The application is free, not open source.
- Code signing
- UptimeLogger is not code-signed; both systems warn on first launch. The installation page describes the one-time step each needs.
- Distribution
- From this website. The installers themselves are hosted as release assets on GitHub and can be downloaded without an account; every release lists SHA-256 checksums.
- Data
- Local SQLite database, no account, no telemetry. The only outbound requests are the connection probes and an optional version check against this website. Privacy
- Developer
- Patrick Bartels, Hamburg, Germany
- Website
- uptimelogger.bartels.ug
- Contact
- Patrick.Bartels@gmail.com
Screenshots
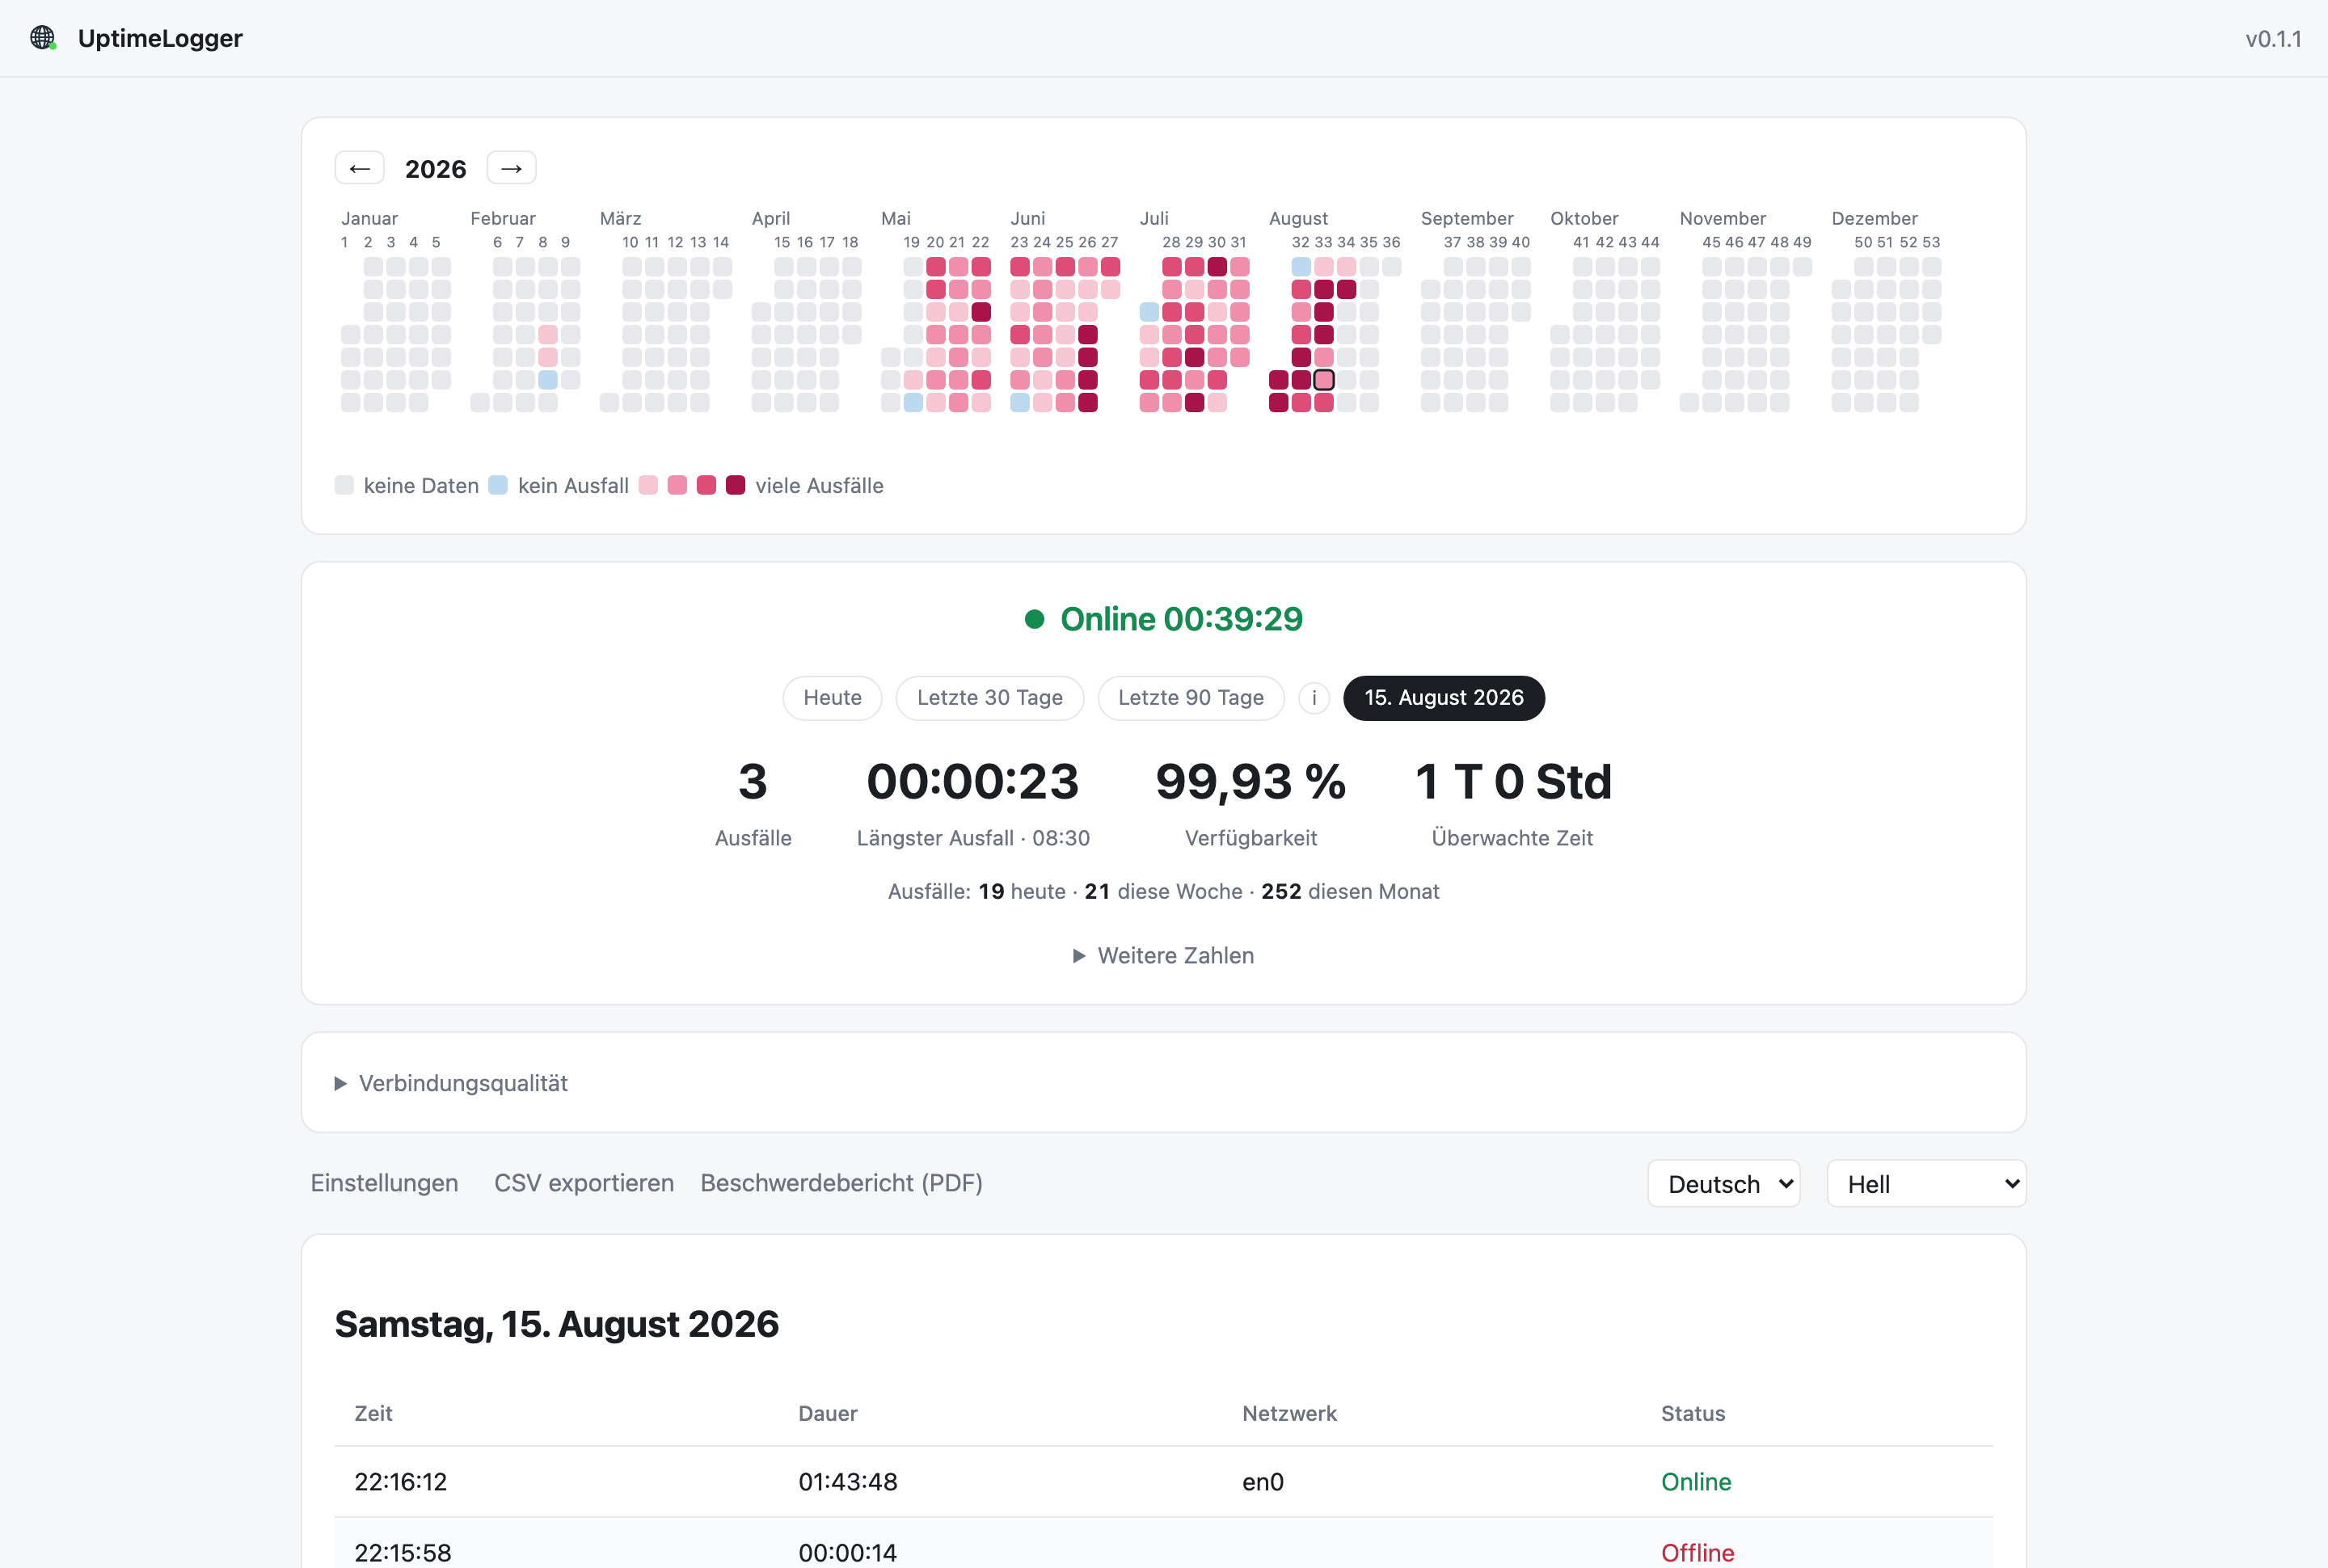
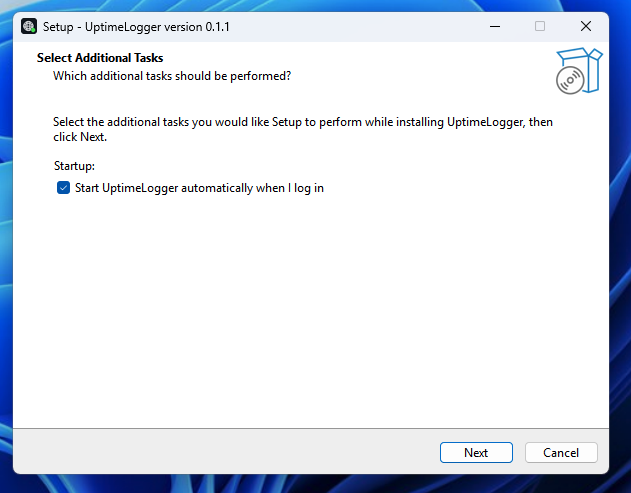
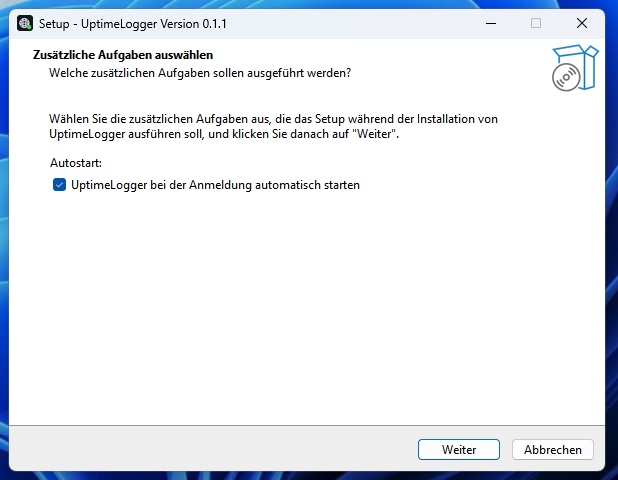
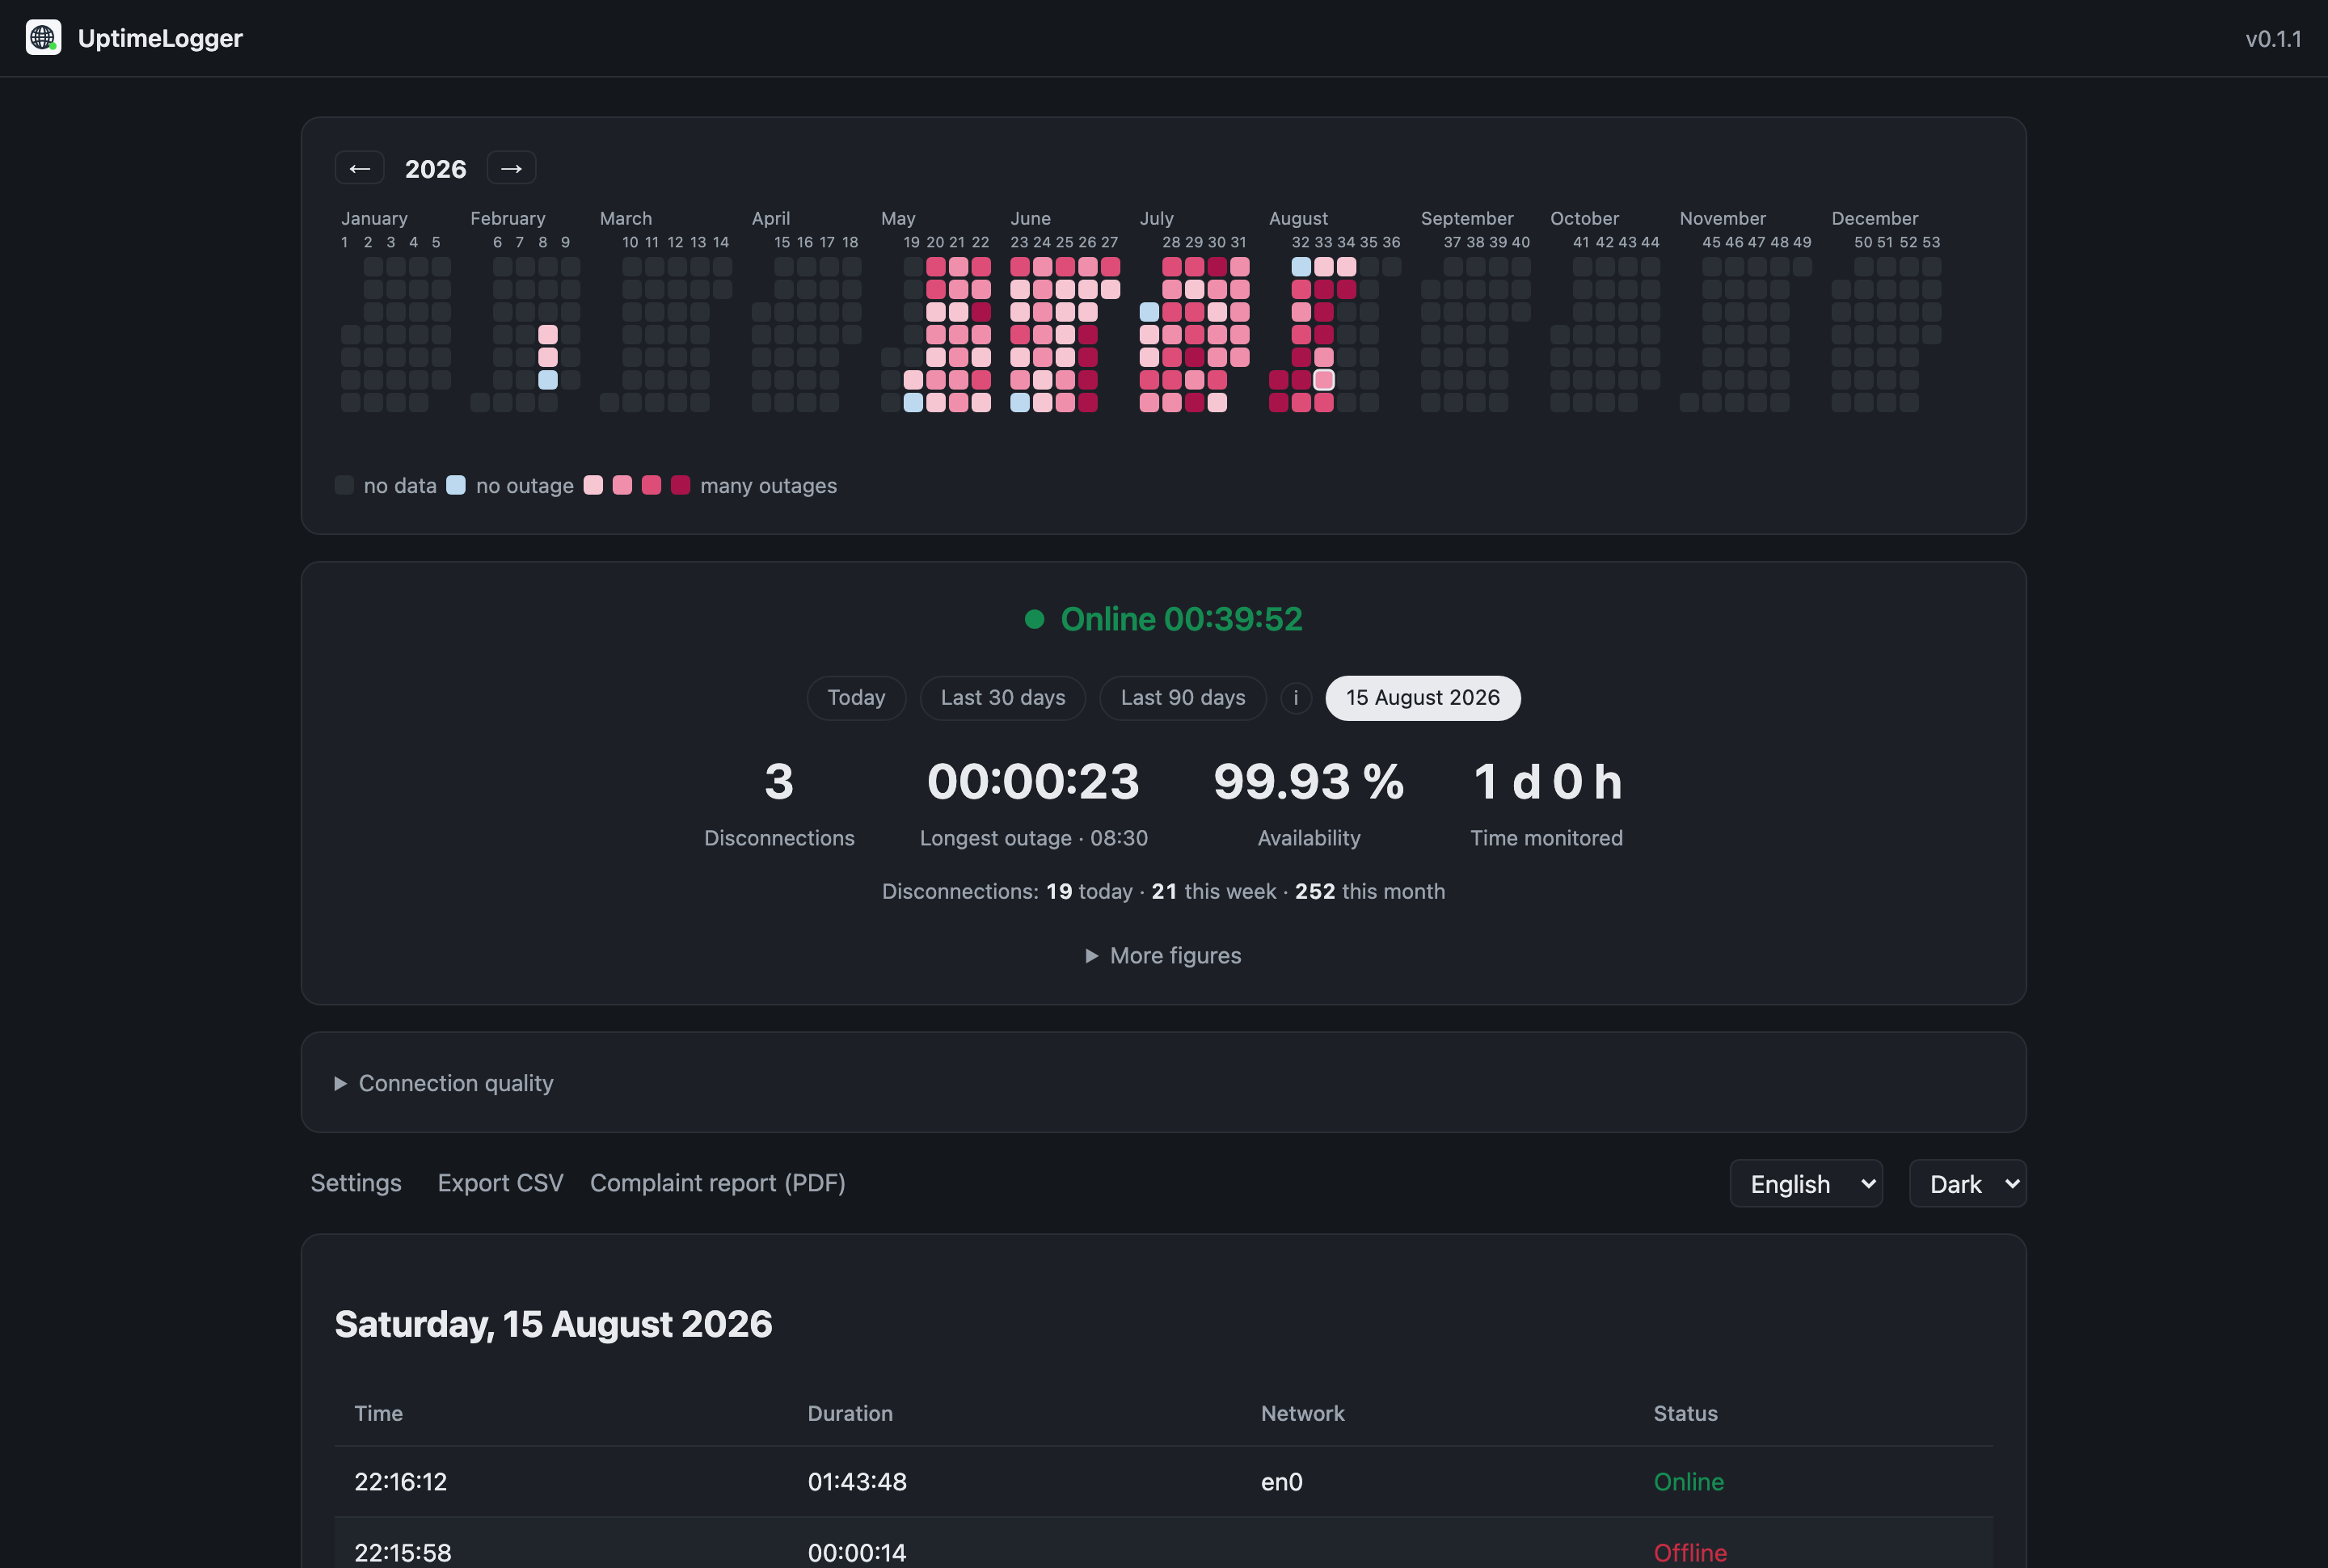
Both are 2880 × 1940 pixels, taken at twice the pixel density, and show the same dashboard in the two interface languages and the two themes it ships with. The day on display is 15 August 2026 on a real recording — three outages, which is an ordinary day for this line rather than a picked one. The two installer shots are 1x screen captures from Windows 11.
- dashboard-en.png — English interface, dark theme
- dashboard-de.png — German interface, light theme
- setup-en.png — the Windows installer, English
- setup-de.png — the Windows installer, German
Icon
- icon.svg — scalable
- icon-256.png — 256 × 256 pixels

What it is not
- Not a speed test. It records whether the connection was there, not how fast it was. Nothing is downloaded to measure bandwidth.
- Not a server or website monitor. It watches the connection of the machine it runs on, from that machine, not a service somewhere else.
- Not a cloud service. There is no backend and no account; the dashboard is served by the application itself.
- Not open source. Free of charge is meant literally and only that.
Questions
Anything not answered here — a specific screenshot, a detail about how something is measured, a version for a different system — is best asked directly by e-mail.